


For the uninitiated, candlestick charts can be confusing. All those lines and shapes can be daunting to look at. But once you know how to read them, they can be extremely useful tools for tracking price movements in the market. In this blog post, we will guide you through everything you need to know about reading candlestick charts. We will cover everything from the basics of what a candlestick is to more advanced concepts like wicks and shadows. By the end, you will be able to confidently interpret any candlestick chart you come across. (Also Read: The Digital Rupee: Everything you need to know)
What is a candlestick chart?
Candlestick charts can be used to show price data for any time frame, but they are most commonly used to depict data for daily, weekly, or monthly intervals. Traders and investors often use candlestick charts to look for trading opportunities based on price patterns.
How to read a candlestick chart?
In this article, we’ll take a look at how to read candlestick charts and what they can tell you about the market.
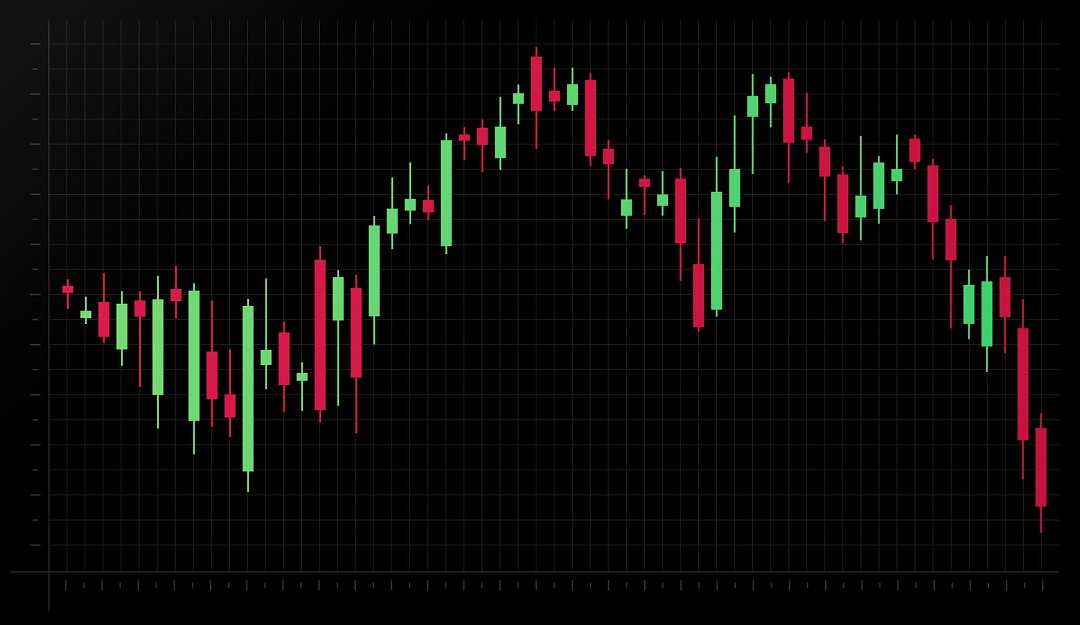
When you look at a candlestick chart, each candlestick represents a specific time period. The body of the candlestick is called the “real body,” and it shows the open and close prices for that time period. The wicks (or shadows) represent the high and low prices for the period.
The color of the real body tells you if the market is in an uptrend or downtrend. If the candlestick is green, it means that prices closed higher than they opened (uptrend). If the candlestick is red, it means that prices closed lower than they opened (downtrend).
What are the main things to look for when reading candlestick charts?
What are the Types of Candlestick Charts?
There are three main types of candlestick charts: single, dual, and triple. Single candlesticks provide the simplest information about market activity. They show the open, close, high, and low prices for a given period of time. Dual candlesticks add another layer of information by also showing the price range for the period. Even more information is given by triple candlesticks, which also show the median price for the time period.
Each type of candlestick has its own benefits and drawbacks. Single candlesticks are great for providing a general overview of market activity, but they don’t offer much in terms of specific details. Dual candlesticks add some detail, but they can be difficult to interpret. Triple candlesticks offer the most information, but they can be very complex to understand.
The best way to learn how to read candlestick charts is to practice with all three types and see which one works best for you. There is no wrong answer; it’s all about finding what works best for your trading style and goals.
What are candlestick chart patterns?
Each of these candlestick patterns has a specific meaning and can give traders clues about what the market is doing. For example, a hammer pattern typically signals that the market is oversold and may be ready to rebound. An inverted hammer pattern can show that the market is overbought and may be ready for a pullback.
Shooting star and doji patterns can indicate potential reversals, while morning and evening star patterns can signal upcoming trend changes. By learning to read these candlestick patterns, traders can get a better sense of what the market is doing and make more informed trading decisions.
Conclusion
Candlestick charts are a great tool for visualizing market data, and they can be used to make informed trading decisions. With a little practice, you’ll be able to read candlestick charts like a pro. So get out there and start practicing! (Also Read: 4 Investment Strategies for Bear Markets)